library(tidyverse)

b_42084 <- readRDS(url("https://gitlab.com/gklab/teaching/rr-f26/-/raw/main/weekly-activities/week-07/b_42084-data.rds?ref_type=heads&inline=false"))
b_burl1 <- readRDS(url("https://gitlab.com/gklab/teaching/rr-f26/-/raw/main/weekly-activities/week-07/burl1-data.rds?ref_type=heads&inline=false"))

#### NOTE
# If you want to download the data "straight from the source" rather
# than from the git repository where I have uploaded it,
# you can use the code below.
# install.packages('pak')
# pak::pak("NOAA-EDAB/buoydata")
# library(tidyverse)
# library(buoydata)
# b_burl1 <- get_buoy_data("BURL1")
# b_42084 <- get_buoy_data("42084")Homework activities
Activity 1
General instructions
Complete this activity as a qmd file and commit the source code, along with the rendered pdf, to your course activities repository by 20 September
- Save the
.qmdsource code for this file to your local directory.
- Edit the document with your responses to the questions, and render the document into an
pdffile. - Commit and push all materials to your “Activities” git repository.
Note: if all else fails, you can email this activity to me as a Word or PDF file.
Grading: Each paper (or dataset, for undergraduate students) you describe is worth 4 points. An additional 5 points are for writing your responses in a qmd file, rendering it to a PDF, and making it available in your course repository.
Instructions for graduate students
Identify five primary research papers that you feel are important for you to know inside-and-out as part of your dissertation research, and which you feel might be good candidates for our course semester project. For each paper, complete the following information:
Instructions for undergraduate students
Explore the data options available for your semester project through the LTER Data Sampler R package: https://lter.github.io/lterdatasampler/. Read each dataset’s vignette, which is available through the “Articles” option in the top menubar. For five of the most interesting datasets, adderess the following questions:
Activity 2
Part 1: Background and data exploration
Background
The R package buoydata, developed and maintained by Andy Beet (link), provides fantastic utility functions for retrieving data from NOAA’s National Buoy Data Center (link). I have used this package to download data from two Buoys (buoy IDs 42084 and BURL1), both located at SouthWest Pass, Louisiana (link).
Both buoys were located in the same region; BURL1 has been collecting data since the 1980s, and 42084 was deployed in 2019. Both are still in operation today, but buoy BURL1 has had lots of missing data values over the last few years. So, in this exercise, we will combine data from both to explore trends in climatic data.
To begin this exercise, download the data from the two buoys to your computer using the code below.
Data exploration
Before starting any visualization, it is good practice to understand the structure of the data. Let’s use the buoydata to understand the structure of the dataset. Run the code below to install and load the buoydata package, and use the function get_variables() for a peek into the content of the data.
# Install packages `pak` and `buoydata` (uncomment these lines if needed)
# install.packages('pak')
# pak::pak("NOAA-EDAB/buoydata")

library(tidyverse)
library(buoydata)
buoydata::get_variables()Part 2: Data streamlining
The two files we’ve downloaded comprise lots of data! Each tibble has 27 columns, and combine to over 425,000 rows. Let’s simplify our life a bit.
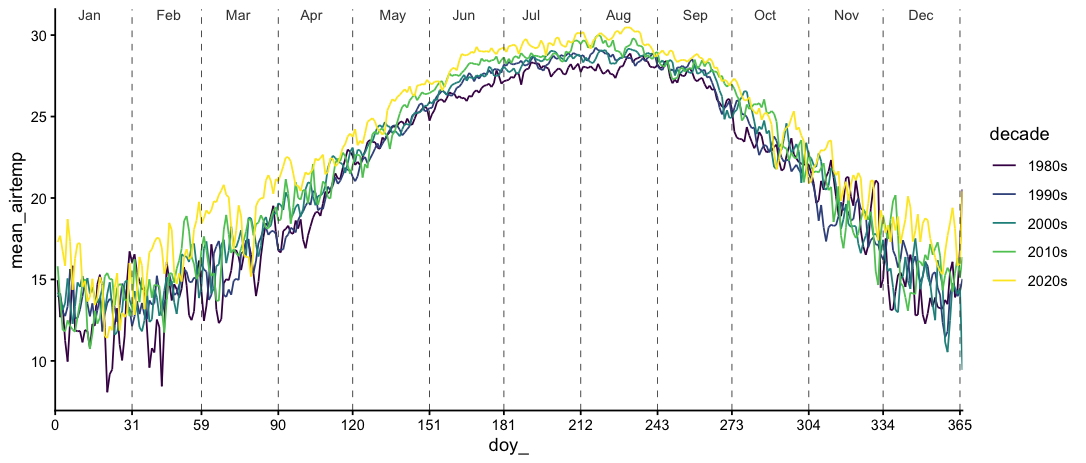
The goal of our exercise is to make the plot show in ?@fig-airtemp, which means we really only need a two columns worth of information – the time of measurement, and the air temperature. So, let’s use select to streamline both datasets:
b_42084 <-
  b_42084 |>
  select(time, ATMP)

b_burl1 <-
  b_burl1 |>
  select(time, ATMP)
On your own, use the function dim to check that each tibble now comprises just 2 columns, but that the number of rows is unchanged.
Next, instead of working with two different tibbles, we can combine the two tibbles together – this is especially easy because both tibbles contain the same columns. We can use the function bind_rows to, well, bind the rows together into just one tibble:
combined_data <-
  bind_rows(b_burl1, b_42084)
In class, we mentioned the package lubridate, one of the sub-packages within tidyverse. Lubridate is especially useful for timeseries data, like what we are working with here.
Let’s use functions from this package to add columns to this combined tibble to know just the year, month, and date of the observations:
combined_data <-
  combined_data |>
  mutate(
    # Make new columns called year_, month_, and doy_
    # using the function year(), month(), and yday() from lubridate
    year_ = year(time),
    month_ = month(time),
    # DOY stands for day-of-year:
    # (e.g. Jan 1 is DOY 1, Feb 15 is DOY 45, ...)
    doy_ = yday(time)
  )
The tibble now has five columns:
head(combined_data)# A tibble: 6 × 5
time ATMP year_ month_ doy_
<dttm> <dbl> <dbl> <dbl> <dbl>
1 1984-02-21 12:00:00 11.1 1984 2 52
2 1984-02-21 13:00:00 10.4 1984 2 52
3 1984-02-21 14:00:00 11.1 1984 2 52
4 1984-02-21 15:00:00 NaN 1984 2 52
5 1984-02-21 16:00:00 10.8 1984 2 52
6 1984-02-21 17:00:00 10.6 1984 2 52We are now ready to work towards visualizing trends in air temperature over time at this location.
Part 3: Visualizing the data
Ultimately, our goal is to make the following visualization:
Let’s work towards this in chunks.
Step 1: Add a new column indicating the decade
The plot we wish to make has data summarized by decade, but this information is currently not directly available in combined_data. This means we will have to make a new column that states the decade based on the information in the year column:
combined_data |>
  # We will use a clever trick to name the decade:
  # For any given year, we can use the first three numbers of the year
  # as the decade name, e.g. if the year is 1989, it belongs to decade "198",
  # and the year 1995 belongs to the decade "199"
  mutate(decade = str_extract(year_, "..."))
# A tibble: 425,398 × 6
time ATMP year_ month_ doy_ decade
<dttm> <dbl> <dbl> <dbl> <dbl> <chr>
1 1984-02-21 12:00:00 11.1 1984 2 52 198
2 1984-02-21 13:00:00 10.4 1984 2 52 198
3 1984-02-21 14:00:00 11.1 1984 2 52 198
4 1984-02-21 15:00:00 NaN 1984 2 52 198
5 1984-02-21 16:00:00 10.8 1984 2 52 198
6 1984-02-21 17:00:00 10.6 1984 2 52 198
7 1984-02-21 18:00:00 10.7 1984 2 52 198
8 1984-02-21 19:00:00 10.6 1984 2 52 198
9 1984-02-21 20:00:00 10.7 1984 2 52 198
10 1984-02-21 21:00:00 10.8 1984 2 52 198
# ℹ 425,388 more rowsThis is a good start, but ultimately we don’t just want 198, 199, 200, 201, and 202 as our decades, we want the labels to say “1980s”, “1990s”, and so forth. Let’s use the function paste0 to make the labels:
combined_data <-
  combined_data |>
  # We will use a clever trick to name the decade:
  # For any given year, we can use the first three numbers of the year
  # as the decade name, e.g. if the year is 1989, it belongs to decade "198",
  # and the year 1995 belongs to the decade "199"
  mutate(decade = str_extract(year_, "...")) |>
  mutate(decade = paste0(decade, "0s"))

head(combined_data)
# A tibble: 6 × 6
time ATMP year_ month_ doy_ decade
<dttm> <dbl> <dbl> <dbl> <dbl> <chr>
1 1984-02-21 12:00:00 11.1 1984 2 52 1980s
2 1984-02-21 13:00:00 10.4 1984 2 52 1980s
3 1984-02-21 14:00:00 11.1 1984 2 52 1980s
4 1984-02-21 15:00:00 NaN 1984 2 52 1980s
5 1984-02-21 16:00:00 10.8 1984 2 52 1980s
6 1984-02-21 17:00:00 10.6 1984 2 52 1980s Step 2: Getting daily averages
The dataset we’re working with has >425,000 rows! Each day has several 24 rows, as the buoy records air temperature once every hour. Ultimately, we just want to know, for each day of year in each decade, what the average air temperature was on that day – that’s what ?@fig-airtemp shows.
Given that we want to get the average air temperature per DOY per decade, we should be thinking that we want to do some grouped operations.
If you completed Question 2 correctly, you should now have all the data necessary to complete a rough draft of the plot.
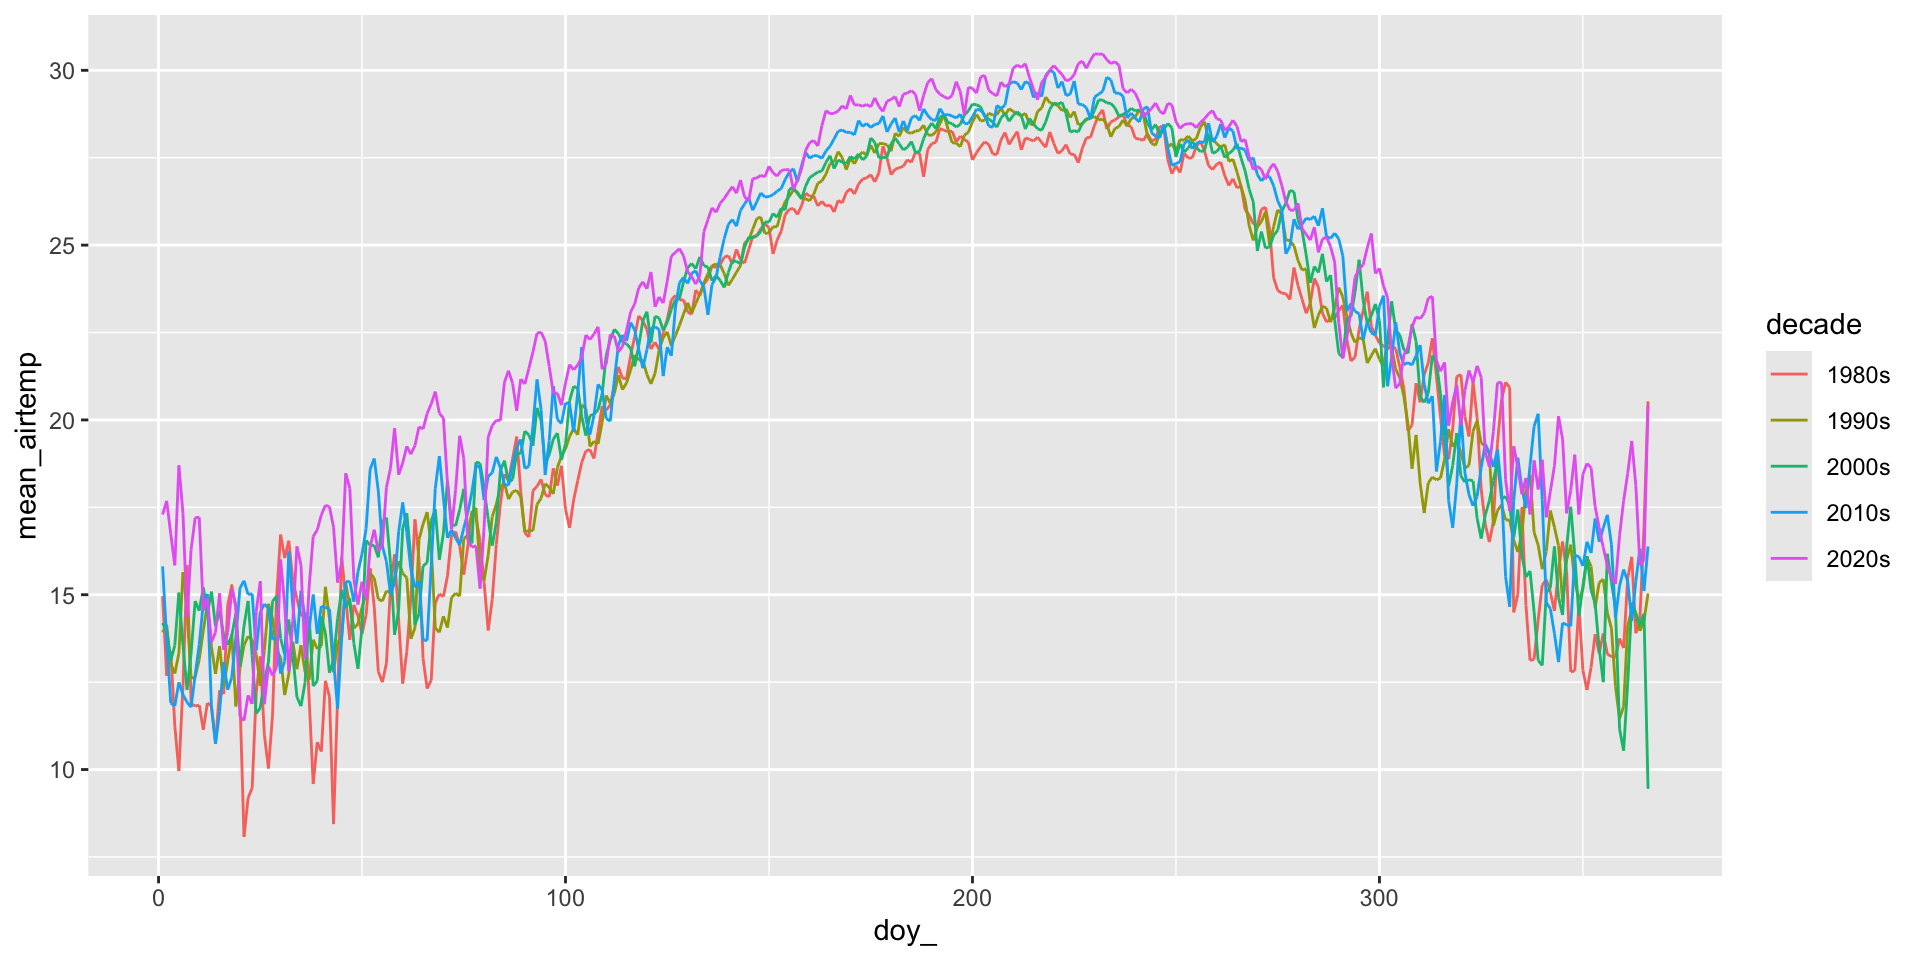
Nice! After question 3, we seem to be very close to our final graph – in fact, all the remaining steps seem to be aesthetic modifications. Let’s turn to those next.
Part 4: Extending beyond
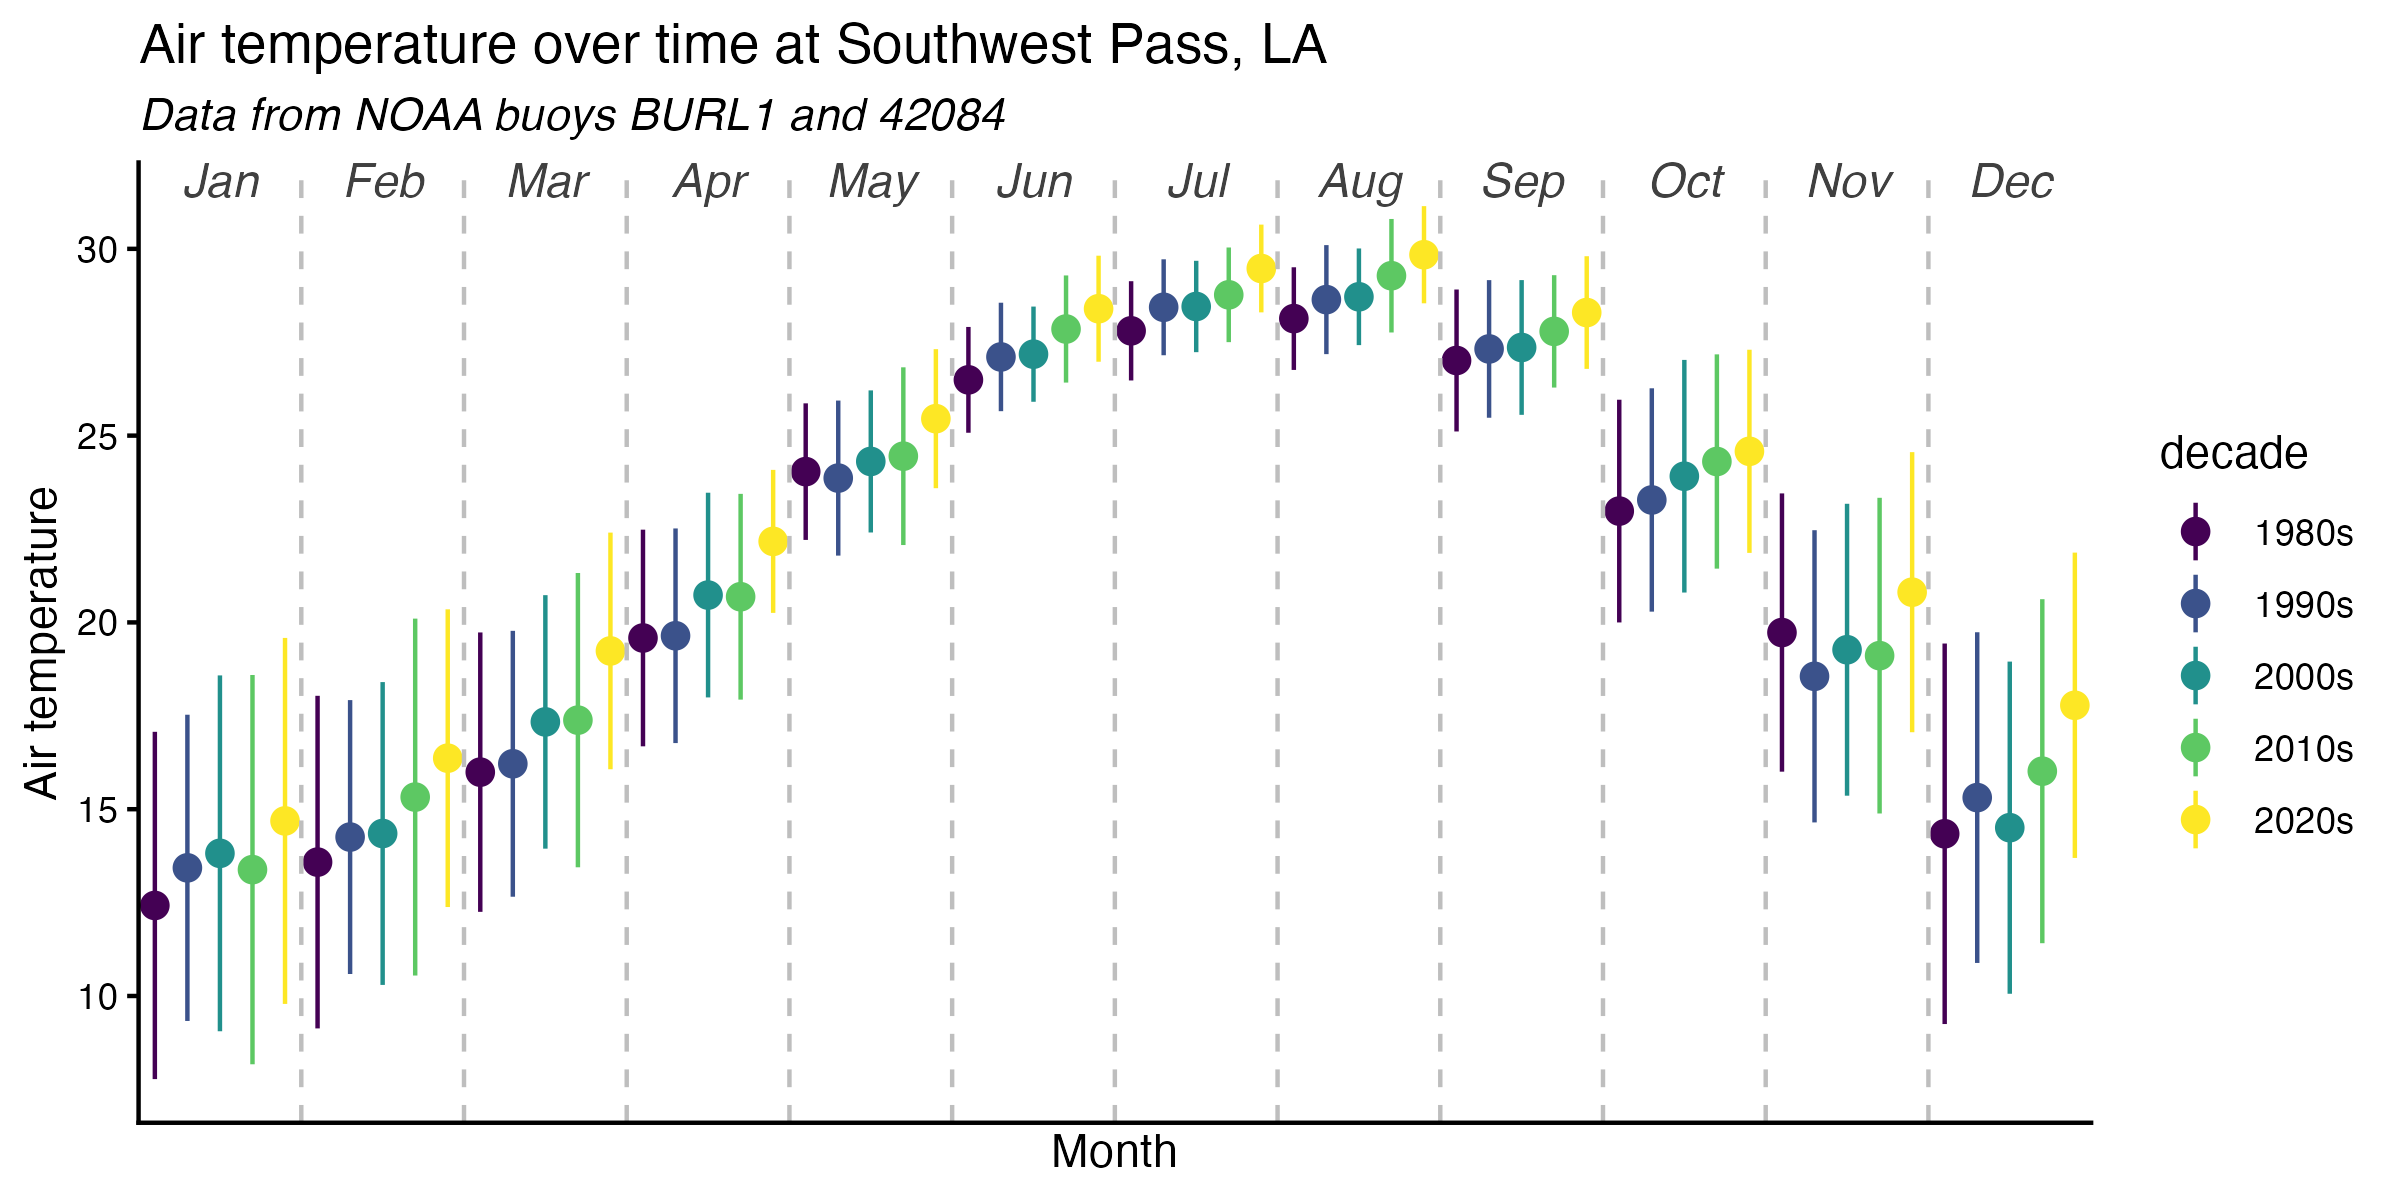
Now that you have considerable expertise in visualization, challenge yourself to make the following plot. Note that to make this plot, I used only the data available within combined_data. Each point represents the mean air temperature of all days within a given month-decade combination. The error bars show the standard deviation of the air temperatures.
Hint: I used geom_pointrange() to create a plot with points and errorbars. I used the sd() function to calculate standard deviations.
Footnotes
If you are stuck, consider exploring the R graph gallery to explore different ways to visualize data↩︎